Statistical Analysis for Income Data
Author: Mostafa Hadavand
Date: 2018-03-03
This notebook presents an example data exploration for CSD income data that can be downloaded from the following link.
[1]:
import pandas as pd
import numpy as np
import matplotlib.pyplot as plt
import warnings
warnings.filterwarnings('ignore')
%reload_ext autoreload
%autoreload 2

%pylab inline --no-import-all
Populating the interactive namespace from numpy and matplotlib
Load the data
[2]:
df_CSD = pd.read_csv('Data/Census2016_AB_CSD.csv',encoding='latin1')
df_CSD.head()
[2]:
| CENSUS_YEAR | GEO_CODE | GEO_LEVEL | GEO_NAME | GNR | GNR_LF | DATA_QUALITY_FLAG | CSD_TYPE_NAME | ALT_GEO_CODE | Dimension | Member_ID | Notes | Total | Male | Female | |
|---|---|---|---|---|---|---|---|---|---|---|---|---|---|---|---|
| 0 | 2016 | 4801003 | 3 | Cypress County | 4.3 | 5.6 | 0 | MD | 4801003 | Population, 2016 (1) | 1 | 1.0 | 7662 | ... | ... |
| 1 | 2016 | 4801003 | 3 | Cypress County | 4.3 | 5.6 | 0 | MD | 4801003 | Population, 2011 (2) | 2 | 2.0 | 7214 | ... | ... |
| 2 | 2016 | 4801003 | 3 | Cypress County | 4.3 | 5.6 | 0 | MD | 4801003 | Population percentage change, 2011 to 2016 | 3 | NaN | 6.2 | ... | ... |
| 3 | 2016 | 4801003 | 3 | Cypress County | 4.3 | 5.6 | 0 | MD | 4801003 | Total private dwellings (3) | 4 | 3.0 | 3222 | ... | ... |
| 4 | 2016 | 4801003 | 3 | Cypress County | 4.3 | 5.6 | 0 | MD | 4801003 | Private dwellings occupied by usual residents (4) | 5 | 4.0 | 2689 | ... | ... |
Check the Member_IDs corresponding to median values
[3]:
df_CSD[['Dimension','Member_ID','Total']][df_CSD['Dimension'].str.match('Median')]\
.groupby(['Dimension','Member_ID']).count()
[3]:
| Total | ||
|---|---|---|
| Dimension | Member_ID | |
| Median after-tax income in 2015 among recipients ($) | 665 | 425 |
| Median after-tax income in 2015 for persons aged 15 years and over not in economic families ($) (51) | 830 | 425 |
| Median after-tax income of couple economic families with children in 2015 ($) | 810 | 425 |
| Median after-tax income of couple economic families without children or other relatives in 2015 ($) | 806 | 425 |
| Median after-tax income of economic families in 2015 ($) | 802 | 425 |
| Median after-tax income of households in 2015 ($) | 743 | 425 |
| Median after-tax income of lone-parent economic families in 2015 ($) | 814 | 425 |
| Median after-tax income of one-person households in 2015 ($) | 746 | 425 |
| Median after-tax income of two-or-more-person households in 2015 ($) | 749 | 425 |
| Median age of the population (6) | 40 | 425 |
| Median employment income in 2015 among recipients ($) | 671 | 425 |
| Median employment income in 2015 for full-year full-time workers ($) (34) | 685 | 425 |
| Median government transfers in 2015 among recipients ($) | 669 | 425 |
| Median market income in 2015 among recipients ($) | 667 | 425 |
| Median monthly shelter costs for owned dwellings ($) (170) | 1674 | 425 |
| Median monthly shelter costs for rented dwellings ($) (176) | 1681 | 425 |
| Median total income in 2015 among recipients ($) | 663 | 425 |
| Median total income in 2015 for persons aged 15 years and over not in economic families ($) (50) | 829 | 425 |
| Median total income of couple economic families with children in 2015 ($) | 809 | 425 |
| Median total income of couple economic families without children or other relatives in 2015 ($) | 805 | 425 |
| Median total income of economic families in 2015 ($) | 801 | 425 |
| Median total income of households in 2015 ($) | 742 | 425 |
| Median total income of lone-parent economic families in 2015 ($) | 813 | 425 |
| Median total income of one-person households in 2015 ($) | 745 | 425 |
| Median total income of two-or-more-person households in 2015 ($) | 748 | 425 |
| Median value of dwellings ($) (172) | 1676 | 425 |
Check Spatial Data
The corresponding shape file is loaded to study the Census Subdivisions. It is required to install geopandas.
[4]:
import geopandas as gpd
shp = 'Data/Alberta_CSD2016/Alberta_CSD2016.shp'
df_spatial = gpd.read_file(shp)
df_spatial.head()
[4]:
| CSDUID | CSDNAME | CSDTYPE | PRUID | PRNAME | CDUID | CDNAME | CDTYPE | CCSUID | CCSNAME | ... | ERNAME | SACCODE | SACTYPE | CMAUID | CMAPUID | CMANAME | CMATYPE | Shape_Leng | Shape_Area | geometry | |
|---|---|---|---|---|---|---|---|---|---|---|---|---|---|---|---|---|---|---|---|---|---|
| 0 | 4815023 | Canmore | T | 48 | Alberta | 4815 | Division No. 15 | CDR | 4815015 | Bighorn No. 8 | ... | Banff--Jasper--Rocky Mountain House | 828 | 3 | 828 | 48828 | Canmore | D | 65444.606318 | 6.938296e+07 | POLYGON ((470559.3832999999 5662470.932800001,... |
| 1 | 4815027 | Ghost Lake | SV | 48 | Alberta | 4815 | Division No. 15 | CDR | 4815015 | Bighorn No. 8 | ... | Banff--Jasper--Rocky Mountain House | 999 | 7 | None | None | None | None | 5207.421246 | 6.681321e+05 | POLYGON ((516587.8195000002 5671021.1709, 5173... |
| 2 | 4812808 | White Fish Lake 128 | IRI | 48 | Alberta | 4812 | Division No. 12 | CDR | 4812014 | St. Paul County No. 19 | ... | Wood Buffalo--Cold Lake | 997 | 5 | None | None | None | None | 58687.129982 | 6.111809e+07 | POLYGON ((706392.4102999996 6025299.4767, 7076... |
| 3 | 4812810 | Cold Lake 149 | IRI | 48 | Alberta | 4812 | Division No. 12 | CDR | 4812004 | Bonnyville No. 87 | ... | Wood Buffalo--Cold Lake | 997 | 5 | None | None | None | None | 48773.548098 | 1.473223e+08 | POLYGON ((808718.5225999998 6031058.0693, 8089... |
| 4 | 4812811 | Kehewin 123 | IRI | 48 | Alberta | 4812 | Division No. 12 | CDR | 4812004 | Bonnyville No. 87 | ... | Wood Buffalo--Cold Lake | 997 | 5 | None | None | None | None | 48449.061245 | 8.484803e+07 | POLYGON ((769856.7632999998 6006472.9333, 7698... |
5 rows × 21 columns
[5]:
df_spatial_AB = df_spatial[df_spatial.PRUID=='48']
print('Total Census Subdivision = %i'%(len(df_spatial_AB)))
df_spatial_AB['CSDUID']=df_spatial_AB['CSDUID'].astype(int)
df_spatial_AB.head()
Total Census Subdivision = 425
[5]:
| CSDUID | CSDNAME | CSDTYPE | PRUID | PRNAME | CDUID | CDNAME | CDTYPE | CCSUID | CCSNAME | ... | ERNAME | SACCODE | SACTYPE | CMAUID | CMAPUID | CMANAME | CMATYPE | Shape_Leng | Shape_Area | geometry | |
|---|---|---|---|---|---|---|---|---|---|---|---|---|---|---|---|---|---|---|---|---|---|
| 0 | 4815023 | Canmore | T | 48 | Alberta | 4815 | Division No. 15 | CDR | 4815015 | Bighorn No. 8 | ... | Banff--Jasper--Rocky Mountain House | 828 | 3 | 828 | 48828 | Canmore | D | 65444.606318 | 6.938296e+07 | POLYGON ((470559.3832999999 5662470.932800001,... |
| 1 | 4815027 | Ghost Lake | SV | 48 | Alberta | 4815 | Division No. 15 | CDR | 4815015 | Bighorn No. 8 | ... | Banff--Jasper--Rocky Mountain House | 999 | 7 | None | None | None | None | 5207.421246 | 6.681321e+05 | POLYGON ((516587.8195000002 5671021.1709, 5173... |
| 2 | 4812808 | White Fish Lake 128 | IRI | 48 | Alberta | 4812 | Division No. 12 | CDR | 4812014 | St. Paul County No. 19 | ... | Wood Buffalo--Cold Lake | 997 | 5 | None | None | None | None | 58687.129982 | 6.111809e+07 | POLYGON ((706392.4102999996 6025299.4767, 7076... |
| 3 | 4812810 | Cold Lake 149 | IRI | 48 | Alberta | 4812 | Division No. 12 | CDR | 4812004 | Bonnyville No. 87 | ... | Wood Buffalo--Cold Lake | 997 | 5 | None | None | None | None | 48773.548098 | 1.473223e+08 | POLYGON ((808718.5225999998 6031058.0693, 8089... |
| 4 | 4812811 | Kehewin 123 | IRI | 48 | Alberta | 4812 | Division No. 12 | CDR | 4812004 | Bonnyville No. 87 | ... | Wood Buffalo--Cold Lake | 997 | 5 | None | None | None | None | 48449.061245 | 8.484803e+07 | POLYGON ((769856.7632999998 6006472.9333, 7698... |
5 rows × 21 columns
Extract Median Data
Choose a Subset
df_663 is a subset of data that contains data for median total income in 2015 among recipients.
[6]:
for item in np.unique(df_CSD[['Dimension']][df_CSD['Member_ID']==663]):
    print(item)
Median total income in 2015 among recipients ($)
[7]:
df_663 = df_CSD[['GEO_CODE', 'GEO_NAME', 'Total', 'Male', 'Female', 'Member_ID']][df_CSD['Member_ID']==663]
df_663.head()
[7]:
| GEO_CODE | GEO_NAME | Total | Male | Female | Member_ID | |
|---|---|---|---|---|---|---|
| 662 | 4801003 | Cypress County | 41920 | 55488 | 30816 | 663 |
| 2909 | 4801006 | Medicine Hat | 36819 | 49477 | 28395 | 663 |
| 5156 | 4801008 | Forty Mile County No. 8 | 35547 | 44608 | 25626 | 663 |
| 7403 | 4801009 | Foremost | 44096 | 60608 | 29824 | 663 |
| 9650 | 4801014 | Bow Island | 32064 | 46592 | 21056 | 663 |
Data quality check
Check if all the rows contain a numeric value
[8]:
df_663[df_663.Total.apply(lambda x: not x.isnumeric())].head()
[8]:
| GEO_CODE | GEO_NAME | Total | Male | Female | Member_ID | |
|---|---|---|---|---|---|---|
| 16391 | 4802002 | Coutts | x | x | x | 663 |
| 68072 | 4803003 | Improvement District No. 4 Waterton | x | x | x | 663 |
| 74813 | 4803008 | Hill Spring | x | x | x | 663 |
| 81554 | 4803016 | Cowley | x | x | x | 663 |
| 101777 | 4803803 | Blood 148A | x | x | x | 663 |
[9]:
np.unique(df_663['Total'][df_663.Total.apply(lambda x: not x.isnumeric())])
[9]:
array(['..', 'F', 'x'], dtype=object)
[10]:
df_663_trim = df_663[df_663.Total.apply(lambda x: x.isnumeric())]
df_663_trim.reset_index(drop=True, inplace=True)
df_663_trim[['Total', 'Male', 'Female']] = df_663_trim[['Total', 'Male', 'Female']].astype(float)
df_663_trim.head()
[10]:
| GEO_CODE | GEO_NAME | Total | Male | Female | Member_ID | |
|---|---|---|---|---|---|---|
| 0 | 4801003 | Cypress County | 41920.0 | 55488.0 | 30816.0 | 663 |
| 1 | 4801006 | Medicine Hat | 36819.0 | 49477.0 | 28395.0 | 663 |
| 2 | 4801008 | Forty Mile County No. 8 | 35547.0 | 44608.0 | 25626.0 | 663 |
| 3 | 4801009 | Foremost | 44096.0 | 60608.0 | 29824.0 | 663 |
| 4 | 4801014 | Bow Island | 32064.0 | 46592.0 | 21056.0 | 663 |
Alternatives for histogram plot
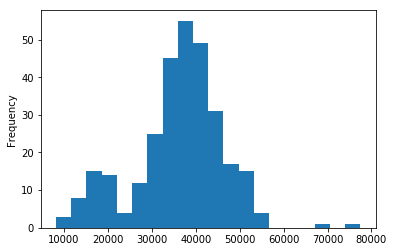
Using pandas built-in plot
[11]:
df_663_trim.Total.plot.hist(bins=20)
[11]:
<matplotlib.axes._subplots.AxesSubplot at 0x1d2c9c517f0>
Using matplotlib
[12]:
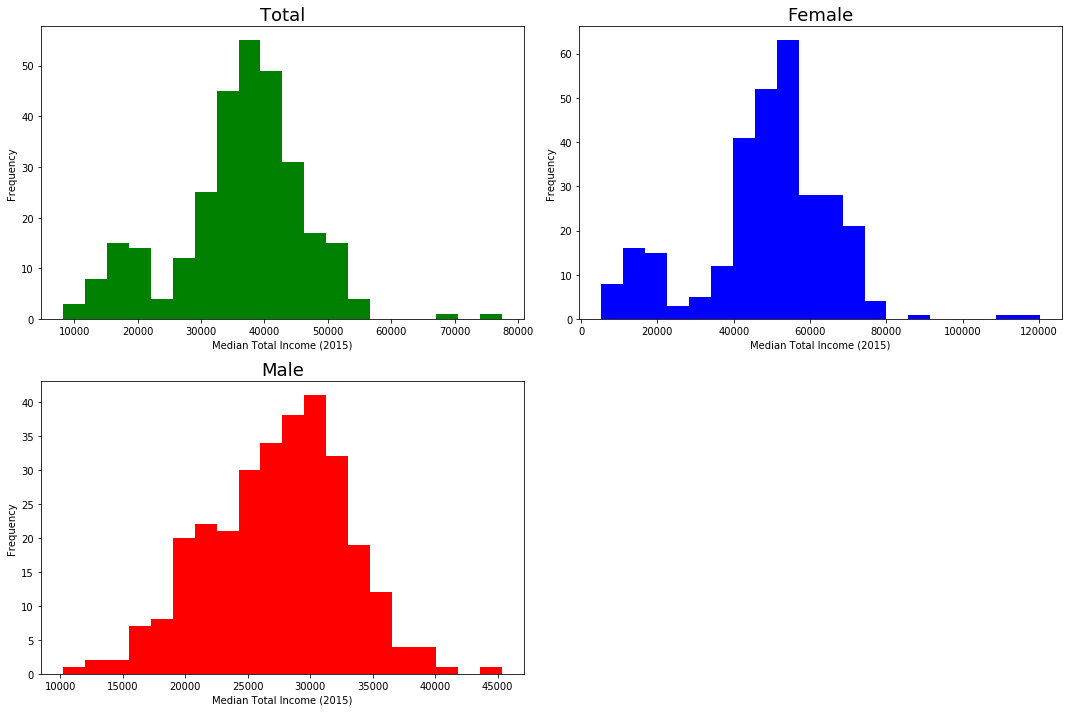
fig = plt.figure(figsize=(15,10))

ax = fig.add_subplot(221)
hist1 = ax.hist(df_663_trim['Total'], bins=20, color='green')
ax.set_title('Total', fontsize=18); ax.set_xlabel('Median Total Income (2015)'); ax.set_ylabel('Frequency')

ax = fig.add_subplot(222)
hist2 = ax.hist(df_663_trim['Male'], bins=20, color='blue')
ax.set_title('Female', fontsize=18); ax.set_xlabel('Median Total Income (2015)'); ax.set_ylabel('Frequency')

ax = fig.add_subplot(223)
hist3 = ax.hist(df_663_trim['Female'], bins=20, color='red')
ax.set_title('Male', fontsize=18); ax.set_xlabel('Median Total Income (2015)'); ax.set_ylabel('Frequency')

plt.tight_layout()
Using Bokeh
[13]:
from bokeh.io import output_notebook
from bokeh.layouts import gridplot
from bokeh.plotting import figure, show
from bokeh.sampledata.autompg import autompg as df
output_notebook()
[14]:
# Histogram Total
p1 = figure(title="Histogram (Total)",tools="pan,wheel_zoom,box_zoom,reset,save", background_fill_color="#D0D3D4")
hist, edges = np.histogram(df_663_trim.Total, density=False, bins=20)
p1.quad(top=hist, bottom=0, left=edges[:-1], right=edges[1:],
        fill_color="green", line_color="#033649")

# Histogram Male
p2 = figure(title="Histogram (Male)",tools="pan,wheel_zoom,box_zoom,reset", background_fill_color="#D0D3D4")
hist, edges = np.histogram(df_663_trim.Male, density=False, bins=20)
p2.quad(top=hist, bottom=0, left=edges[:-1], right=edges[1:],
        fill_color="blue", line_color="#033649")

# Histogram Female
p3 = figure(title="Histogram (Female)",tools="pan,wheel_zoom,box_zoom,reset", background_fill_color="#D0D3D4")
hist, edges = np.histogram(df_663_trim.Female, density=False, bins=20)
p3.quad(top=hist, bottom=0, left=edges[:-1], right=edges[1:],
        fill_color="red", line_color="#033649")

show(gridplot(p1,p2,p3, ncols=2, plot_width=400, plot_height=400, toolbar_location='right'))
Custom Plots
[15]:
import PythonTools as PT
[16]:
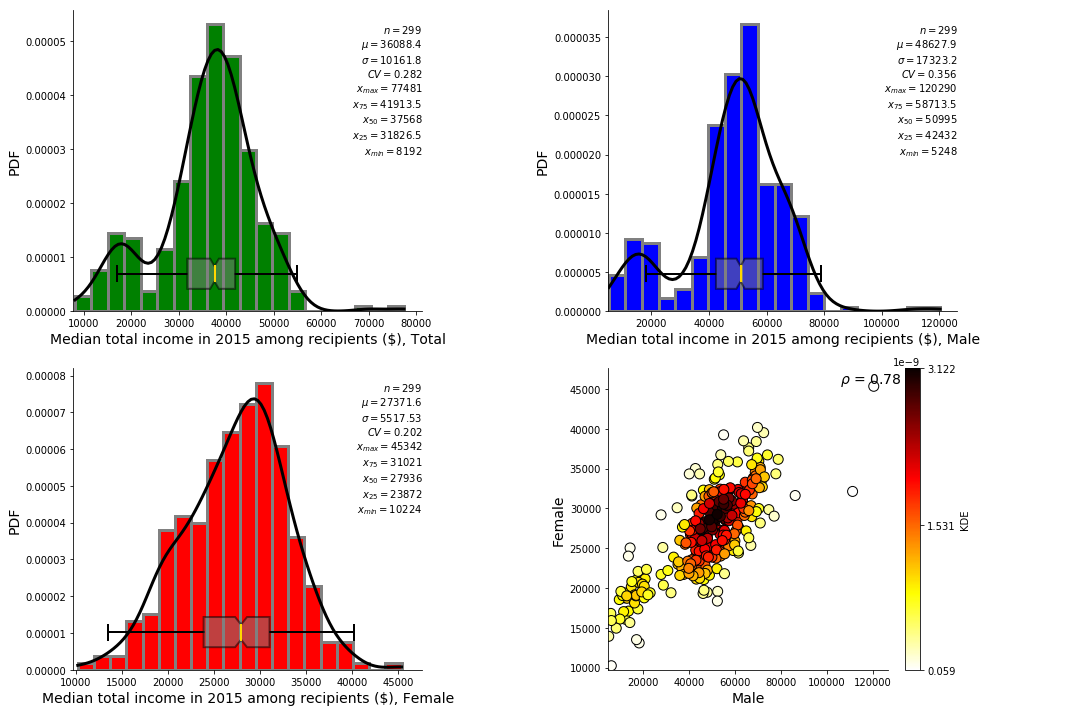
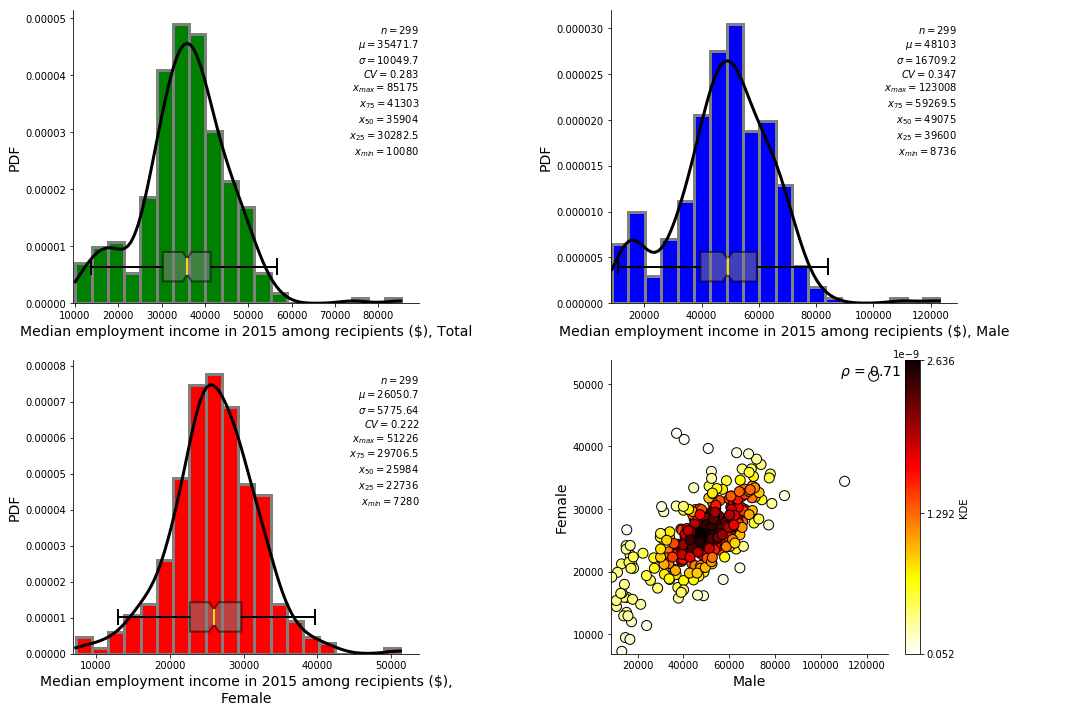
fig = plt.figure(figsize=(15,10))

main_title = df_CSD['Dimension'][df_CSD.Member_ID==663].as_matrix()[0]

ax = fig.add_subplot(221)
PT.pdf_plot(df_663_trim['Total'], bw=-1, ax=ax, line_color='gray', labelfont=14,
            xlabel=main_title+', Total', barcolor='green', kde_color='black')

ax = fig.add_subplot(222)
PT.pdf_plot(df_663_trim['Male'], bw=-1, ax=ax, line_color='gray',labelfont=14,
            xlabel=main_title+', Male', barcolor='blue', kde_color='black')

ax = fig.add_subplot(223)
PT.pdf_plot(df_663_trim['Female'], bw=-1, ax=ax, line_color='gray',labelfont=14,
            xlabel=main_title+', Female', barcolor='red', kde_color='black')

ax = fig.add_subplot(224)
PT.bv_plot(df_663_trim['Male'],df_663_trim['Female'],bw=-1, ax=ax,
           xlabel='Male', label_font_size= 14,
           ylabel='Female', fontsize=14)

plt.tight_layout()
Location Map
[17]:
df_663_trim_spatial = df_spatial_AB.merge(df_663_trim, how='inner', left_on='CSDUID',
                                          right_on='GEO_CODE',suffixes=('_x', '_y'))
[18]:
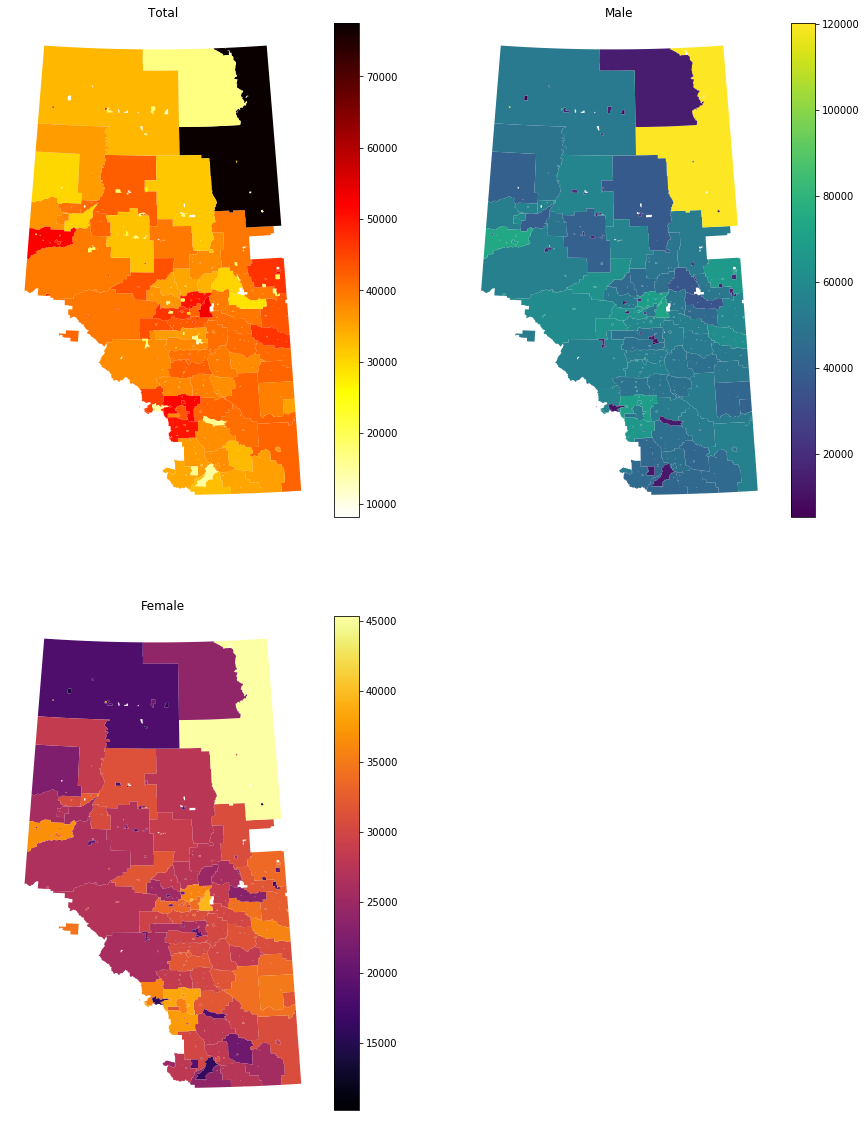
print('The total numbee of census subdivision with data: %i'%(len(df_663_trim_spatial)))
The total numbee of census subdivision with data: 299
[19]:
fig = plt.figure(figsize=(15,20))

ax = fig.add_subplot(221)
df_663_trim_spatial.plot(column='Total', cmap='hot_r',ax=ax, legend=True)
ax.set_frame_on(False); ax.axes.get_yaxis().set_visible(False); ax.axes.get_xaxis().set_visible(False)
ax.set_title('Total')

ax = fig.add_subplot(222)
df_663_trim_spatial.plot(column='Male', cmap='viridis',ax=ax, legend=True)
ax.set_frame_on(False); ax.axes.get_yaxis().set_visible(False); ax.axes.get_xaxis().set_visible(False)
ax.set_title('Male')

ax = fig.add_subplot(223)
df_663_trim_spatial.plot(column='Female', cmap='inferno',ax=ax, legend=True)
ax.set_frame_on(False); ax.axes.get_yaxis().set_visible(False); ax.axes.get_xaxis().set_visible(False)
ax.set_title('Female')
[19]:
Text(0.5,1,'Female')
Consider writing a wrapper (repeatability)
[24]:
from Accessories import summary_stat as ss
[25]:
ss.summary_stat(df_CSD,663,outfl=True)
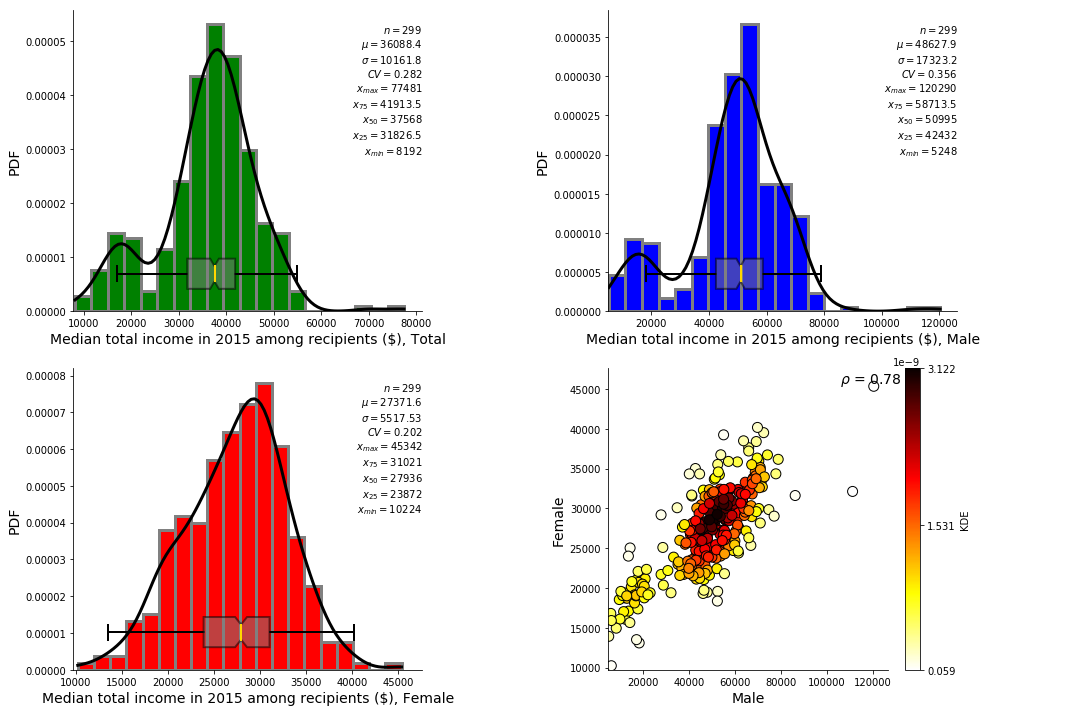
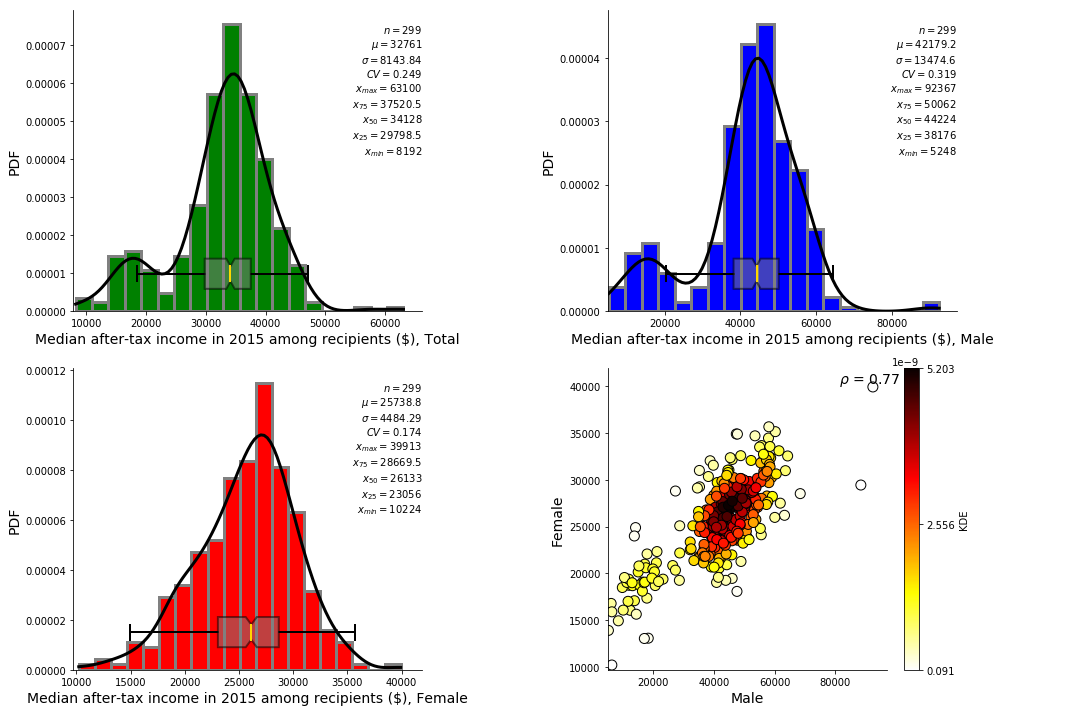
[26]:
ss.summary_stat(df_CSD,665,outfl=True)
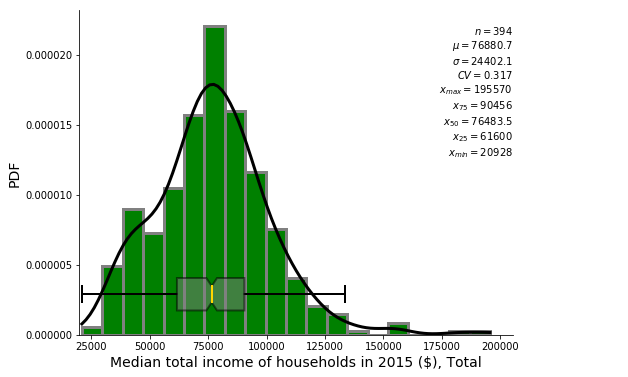
[27]:
ss.summary_stat(df_CSD, 742,outfl=True)
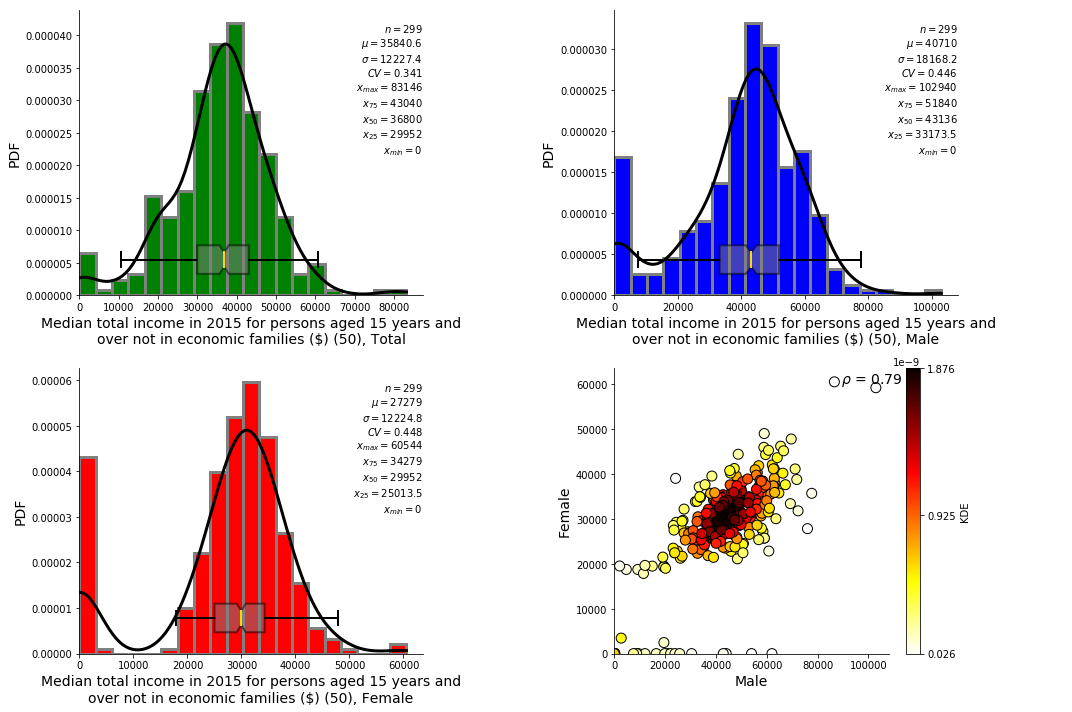
[28]:
ss.summary_stat(df_CSD, 829,outfl=True)
[29]:
ss.summary_stat(df_CSD, 671,outfl=True)
[ ]: